Getting your blank maps
We need to have “blank maps” to color in as thematic maps, and optionally spatial data (points, lines) to add. Two sources:
- Dowloaded file [focus here].
- Provided through an R-package [see other workshop.
Various formats for spatial data possible: Shapefile, GeoJSON, KML, GPX-tracks, etc. Downloading or receiving a Shapefile will likely be the most common scenario for historians.
Recommended: Use st_read() function from the sf library, as it returns a spatial feature object and is based on GDAL: hard to find a format that is not covered.
Points of attention:
- For further manipulation we want objects supported by the
sf-library. When loading spatial data throughst_read(), it is in the correct format, if another route is needed spatial objects can be converted withst_as_sf(). - Pay attention to the included identifier in the spatial dataset (NIS-code, census-code, etc.) for merging other data in later steps.
# load general packages used below
library(dplyr) # tidyverse datamanipulation library
library(sf) # tidyverse spatial features library
library(mapview) # library for interactive exploration of spatial data
library(tmap) # library for thematic maps
library(here) # optional helper library for loading data without absolute pathsExample: load railway tracks
raillines <- st_read(here('data/source/census_1851_raillines/1851EngWalesScotRail_Lines.shp'))# quick interactive look using mapview() from mapview library
mapview(raillines)# quick static thematic map using qtm() from tmap library
qtm(raillines)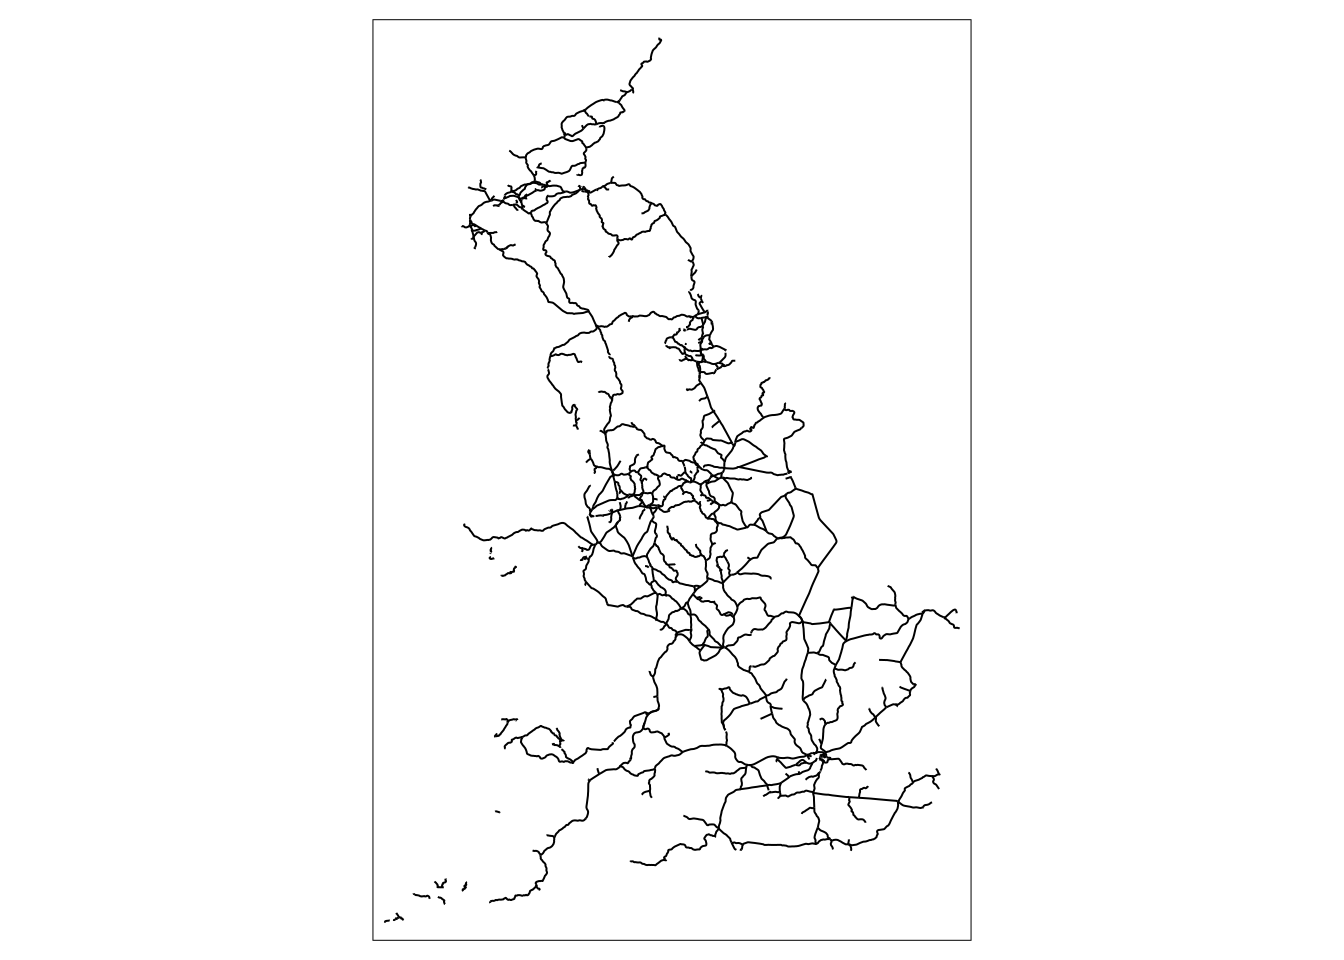
Example: load cencus districts
districts_spatial <- st_read(here('data/source/census_1851_districts/1851EngWalesRegistrationDistrict.shp'))mapview(districts_spatial)