Some motivating examples
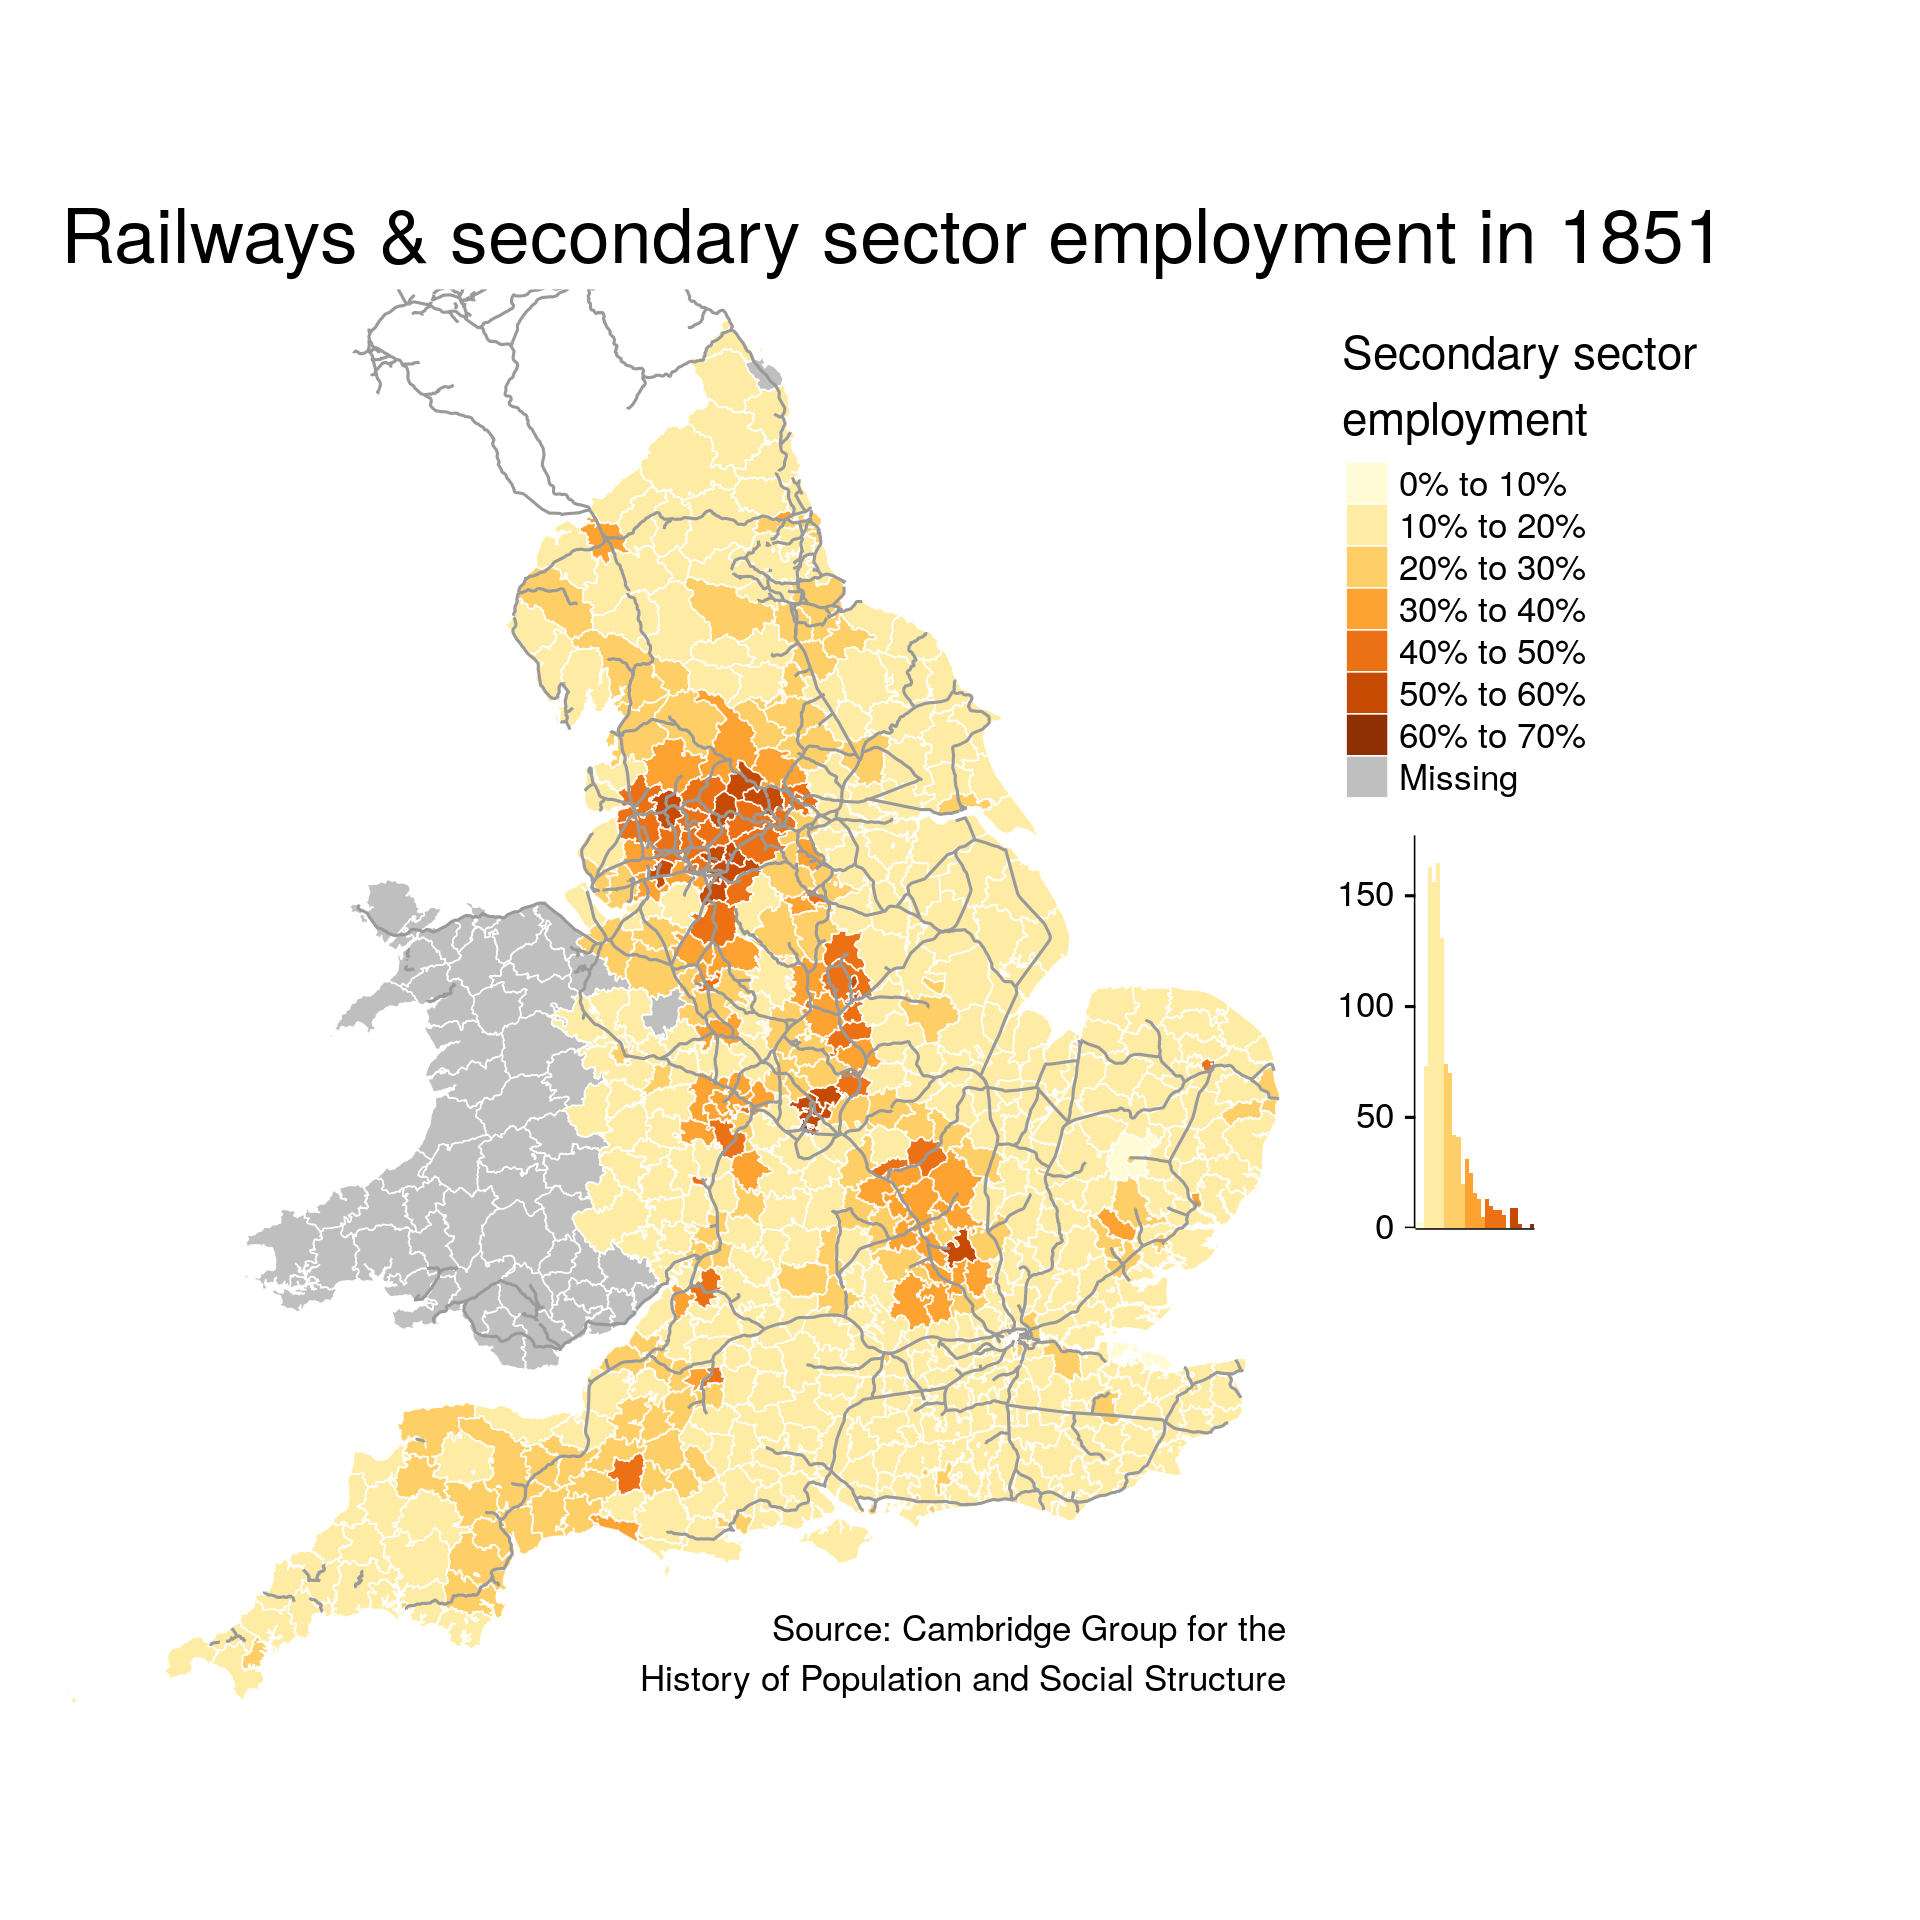
- Example we’ll be working towards in this workshop: map of railways & secondary sector employment in England 1851 in static and interactive versions.
- Some examples of thematic maps from a previous workshop.
- More examples made with
tmap, the R package we will be demonstrating are online.
- Example online press release HIVA - KU Leuven with a interactive map on KU Leuven-website.
Why (not) R for making maps?
|
Learning curve / no GUI |
| free & open source |
|
| large community & ecosystem |
|
| very broad range of libraries |
very broad range of libraries (docs) |
| statistical programming language |
statistical programming language |
Alternative for example: dedicated GUI-driven GIS-software such as QGis.
With R ecosystem & programming background:
- Stronger focus on ‘data science’: collecting, reading, manipulating, visualising, communicating about data beyond the ‘traditional’ reporting of statistical analyses. More info: tidyverse, [“R for Data Science”.
- Spatial data is treated in analysis like a regular dataframe (with a ‘geometry’ column): spatial analysis & “regular” analysis(skilss) move closer [more info: simple features-standard in R
Consequences:
- Enables quick spatial data-exploration in single program & work-flow.
- Novel ways of approaching, using, presenting (esp. digital, large scale) datasources.
Example of novel applications using R to combine quering API’s, spatial operations, visualising on externally provided interactive maps, etc.: Exploring historical maps and spatial data with R and OpenStreetMap.
Worked example in this workshop: rail and industry in 1851 England
Data-source: The occupational structure of Britain 1379-1911, Cambridge Group for the History of Population and Social Structure.
We will illustrate throughout example common steps for thematic maps:
- Load spatial data.
- Load and add “regular” data-of-intrest.
- Manipulate (spatial) data.
- Plot map.